He has to throw money at his base of racists, white supremacists, fascists, and misogynists. Also he is proud of his base you might say he is a PROUD BOY.
Not just a little more, either!
Good. Waste all that money because as long as the Liberals and NDP work together, Squinty McProudBoy will never become PM and will eventually lose the leadership for failing to make a difference.
Is this their “salaries” for the quarter only? If there’s multi lines, it’s cumulative I guess?
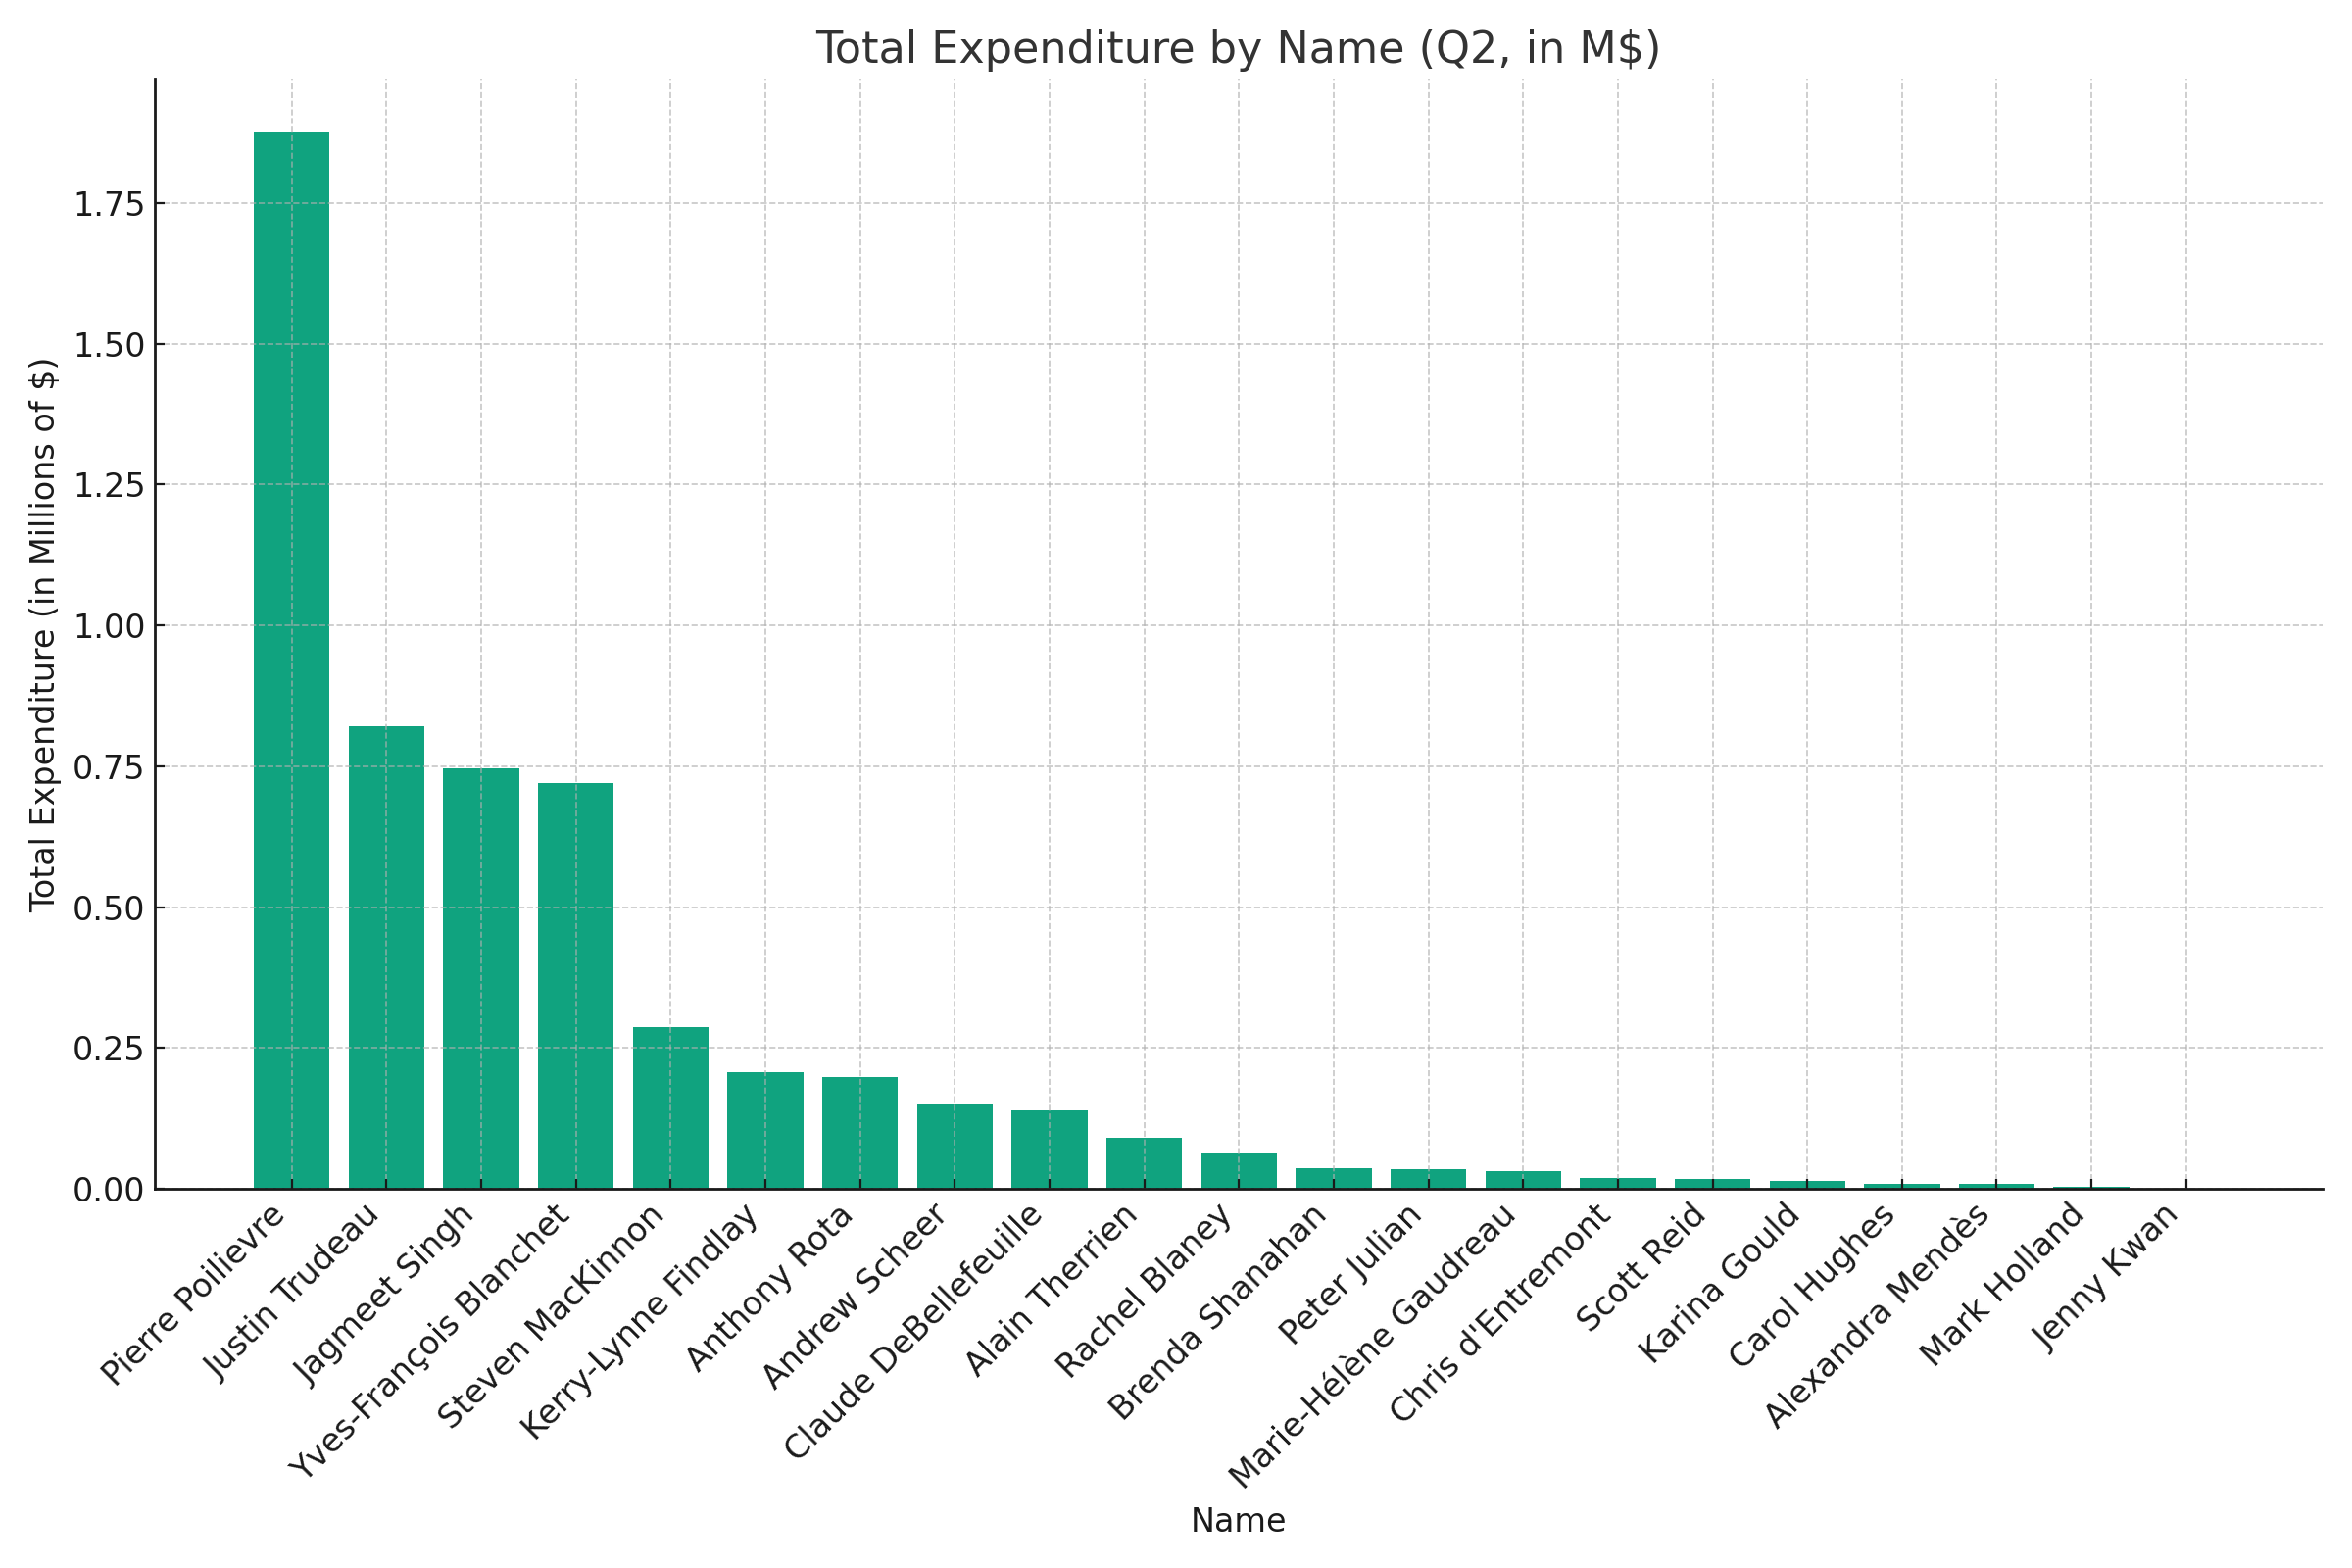
Last Quarter (Q2): total expenditure by name, with all costs added to salaries (generated by chatgpt)

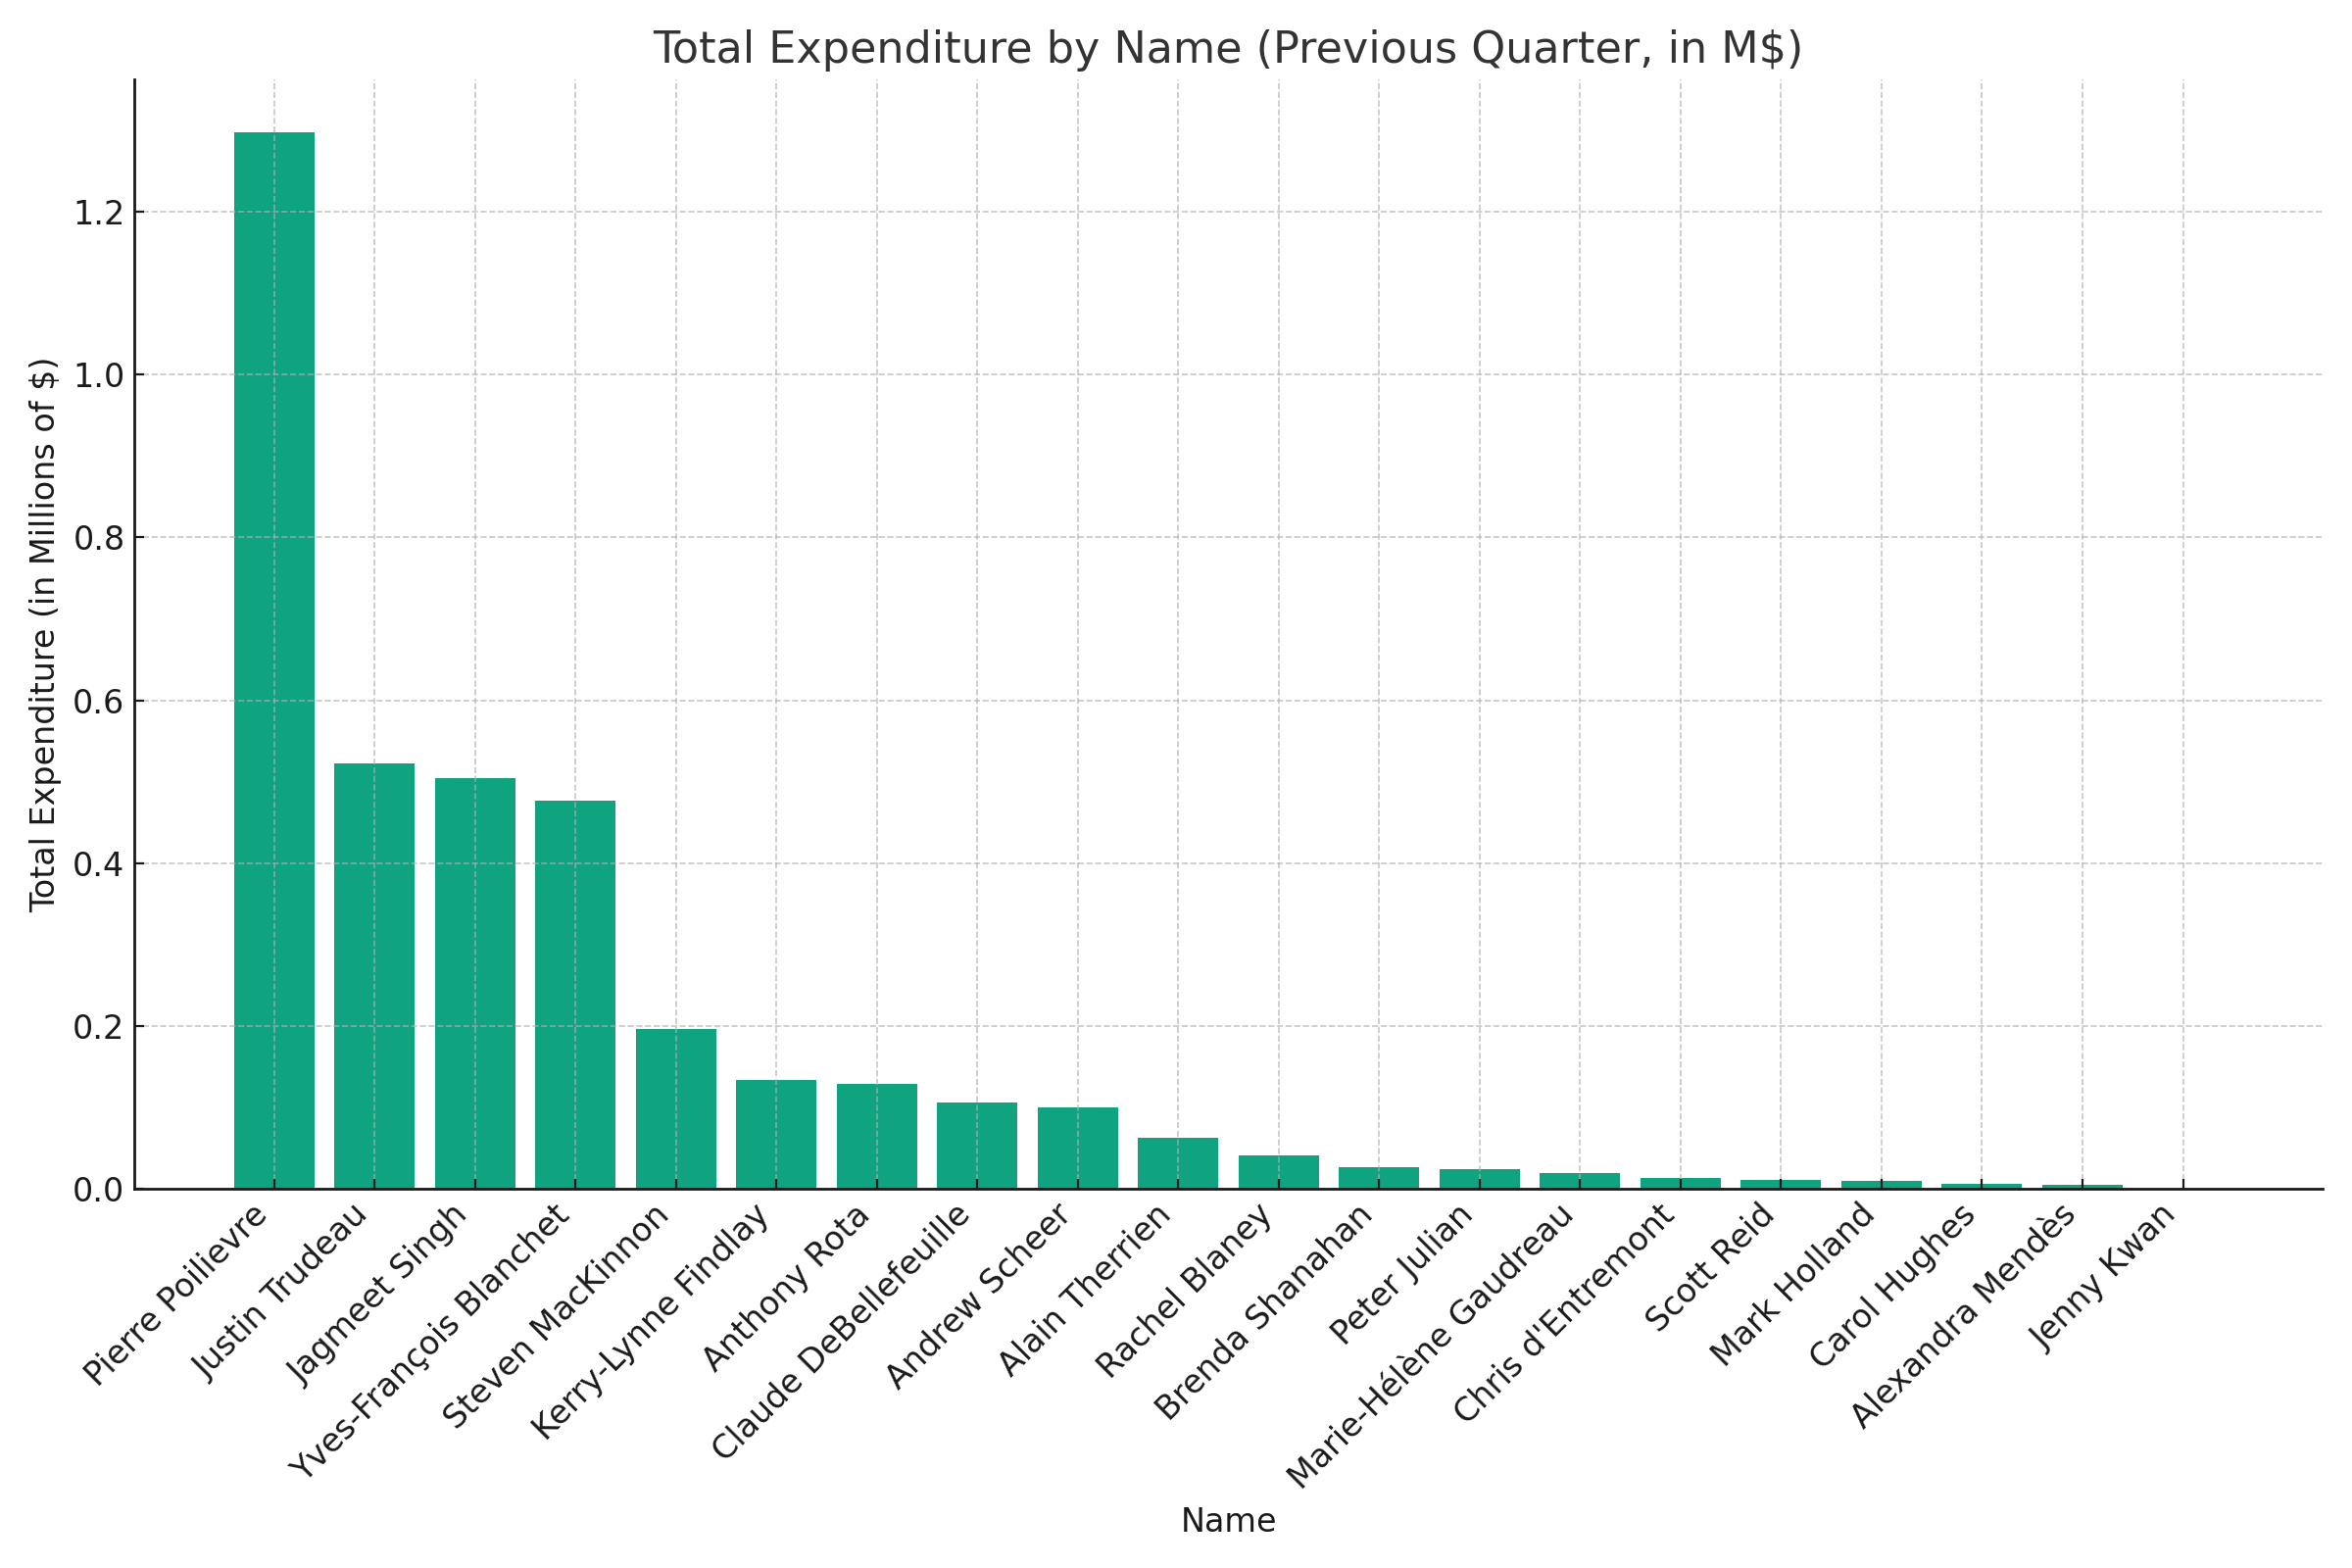
Previous Quarter (Q1):

GPT can generate graphs? I’ll have to download the the CSVs and crunch the numbers myself. I don’t fully trust GPT for something like this.
You don’t need to download/CSV anything if you don’t want to.
Open Excel, Data tab, Get Data, From Web, paste in the linked website(change the url to the right time period if you want a specific one), it will automatically detect the table(s) of data, select the right one (if there are multiples on a page) and load the data directly.
Yay Excel.
I’ve checked for poilievre mentally and it should be close enough
His choice I guess.


