
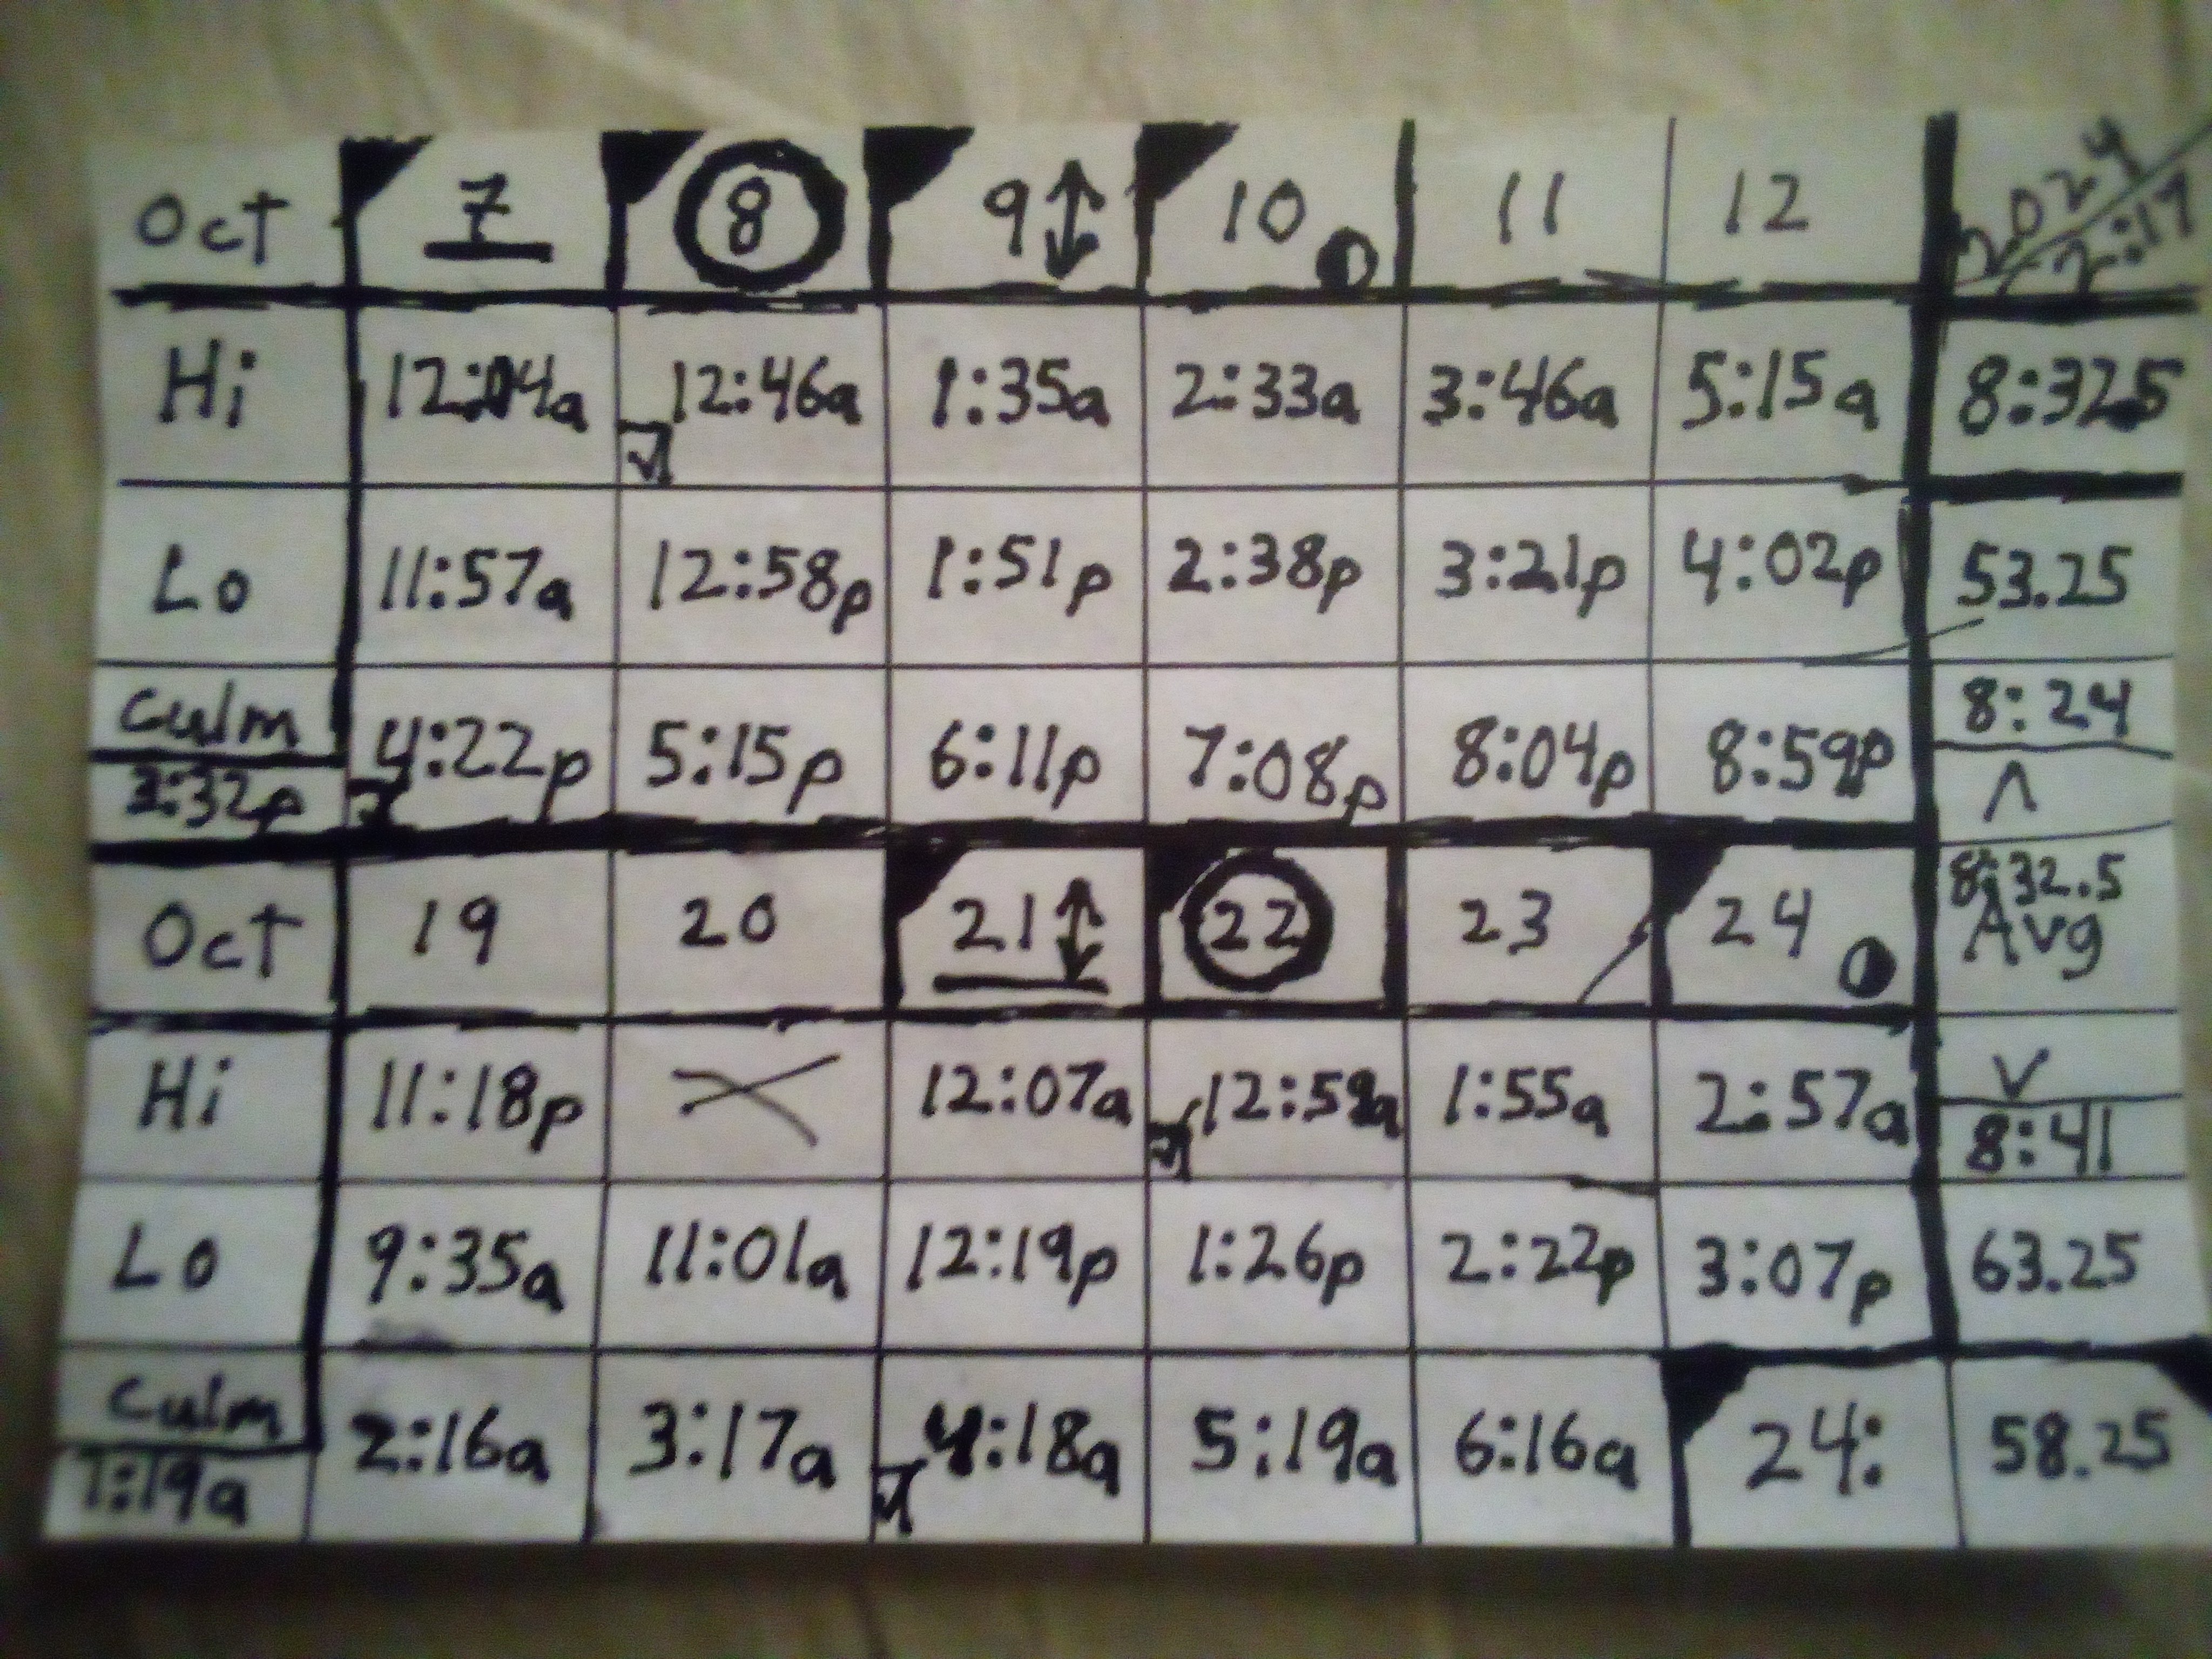
I dunno, but I drew this out in ink from actual tidal and lunar data at the end of September, in ink, to half-ass program my Casio WS-1300H wristwatch tide predictions. Way easier said than done.
The data is very region specific, but I noticed a pattern for the month of October, and assumed that there might be an eclipse sometime during October.
Apparently I was right. Today, October 2nd, Easter Island had a solar eclipse.
I had no idea that it was ‘Inktober’ when I wrote and drew all this out. It’s just meant to determine timing data. I don’t even do things like this in ink, but I felt it necessary this time.
If the right column doesn’t seem to make much sense initially, I totally understand. I know what numbers I stuck where.
Sorry this isn’t exactly artwork in any conventional sense, but if anyone wants to better understand my chart, I’ll try my best to answer any questions.
Mods, I hope this post is okay here, but if not, I understand.
Nah I’m OK with it personally, and from the votes seems everyone else is too.
Good work man. It meets the prompt I’d say, and looks pretty nice. I’d call it art