
cross-posted from: https://lemmy.ca/post/40252119
Fair Vote Canada on Bluesky
How is this democratic?
It’s time for proportional representation.
#cdnpoli #onpoli
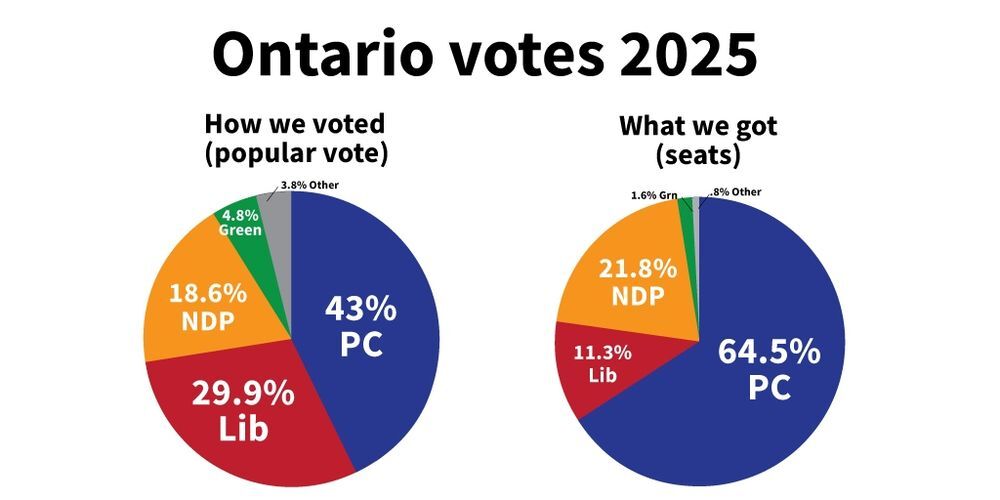
A political infographic titled ‘Ontario votes 2025’ compares the popular vote and seat distribution in the Ontario election. On the left, a pie chart labeled ‘How we voted (popular vote)’ shows: PC (43%), Liberal (29.9%), NDP (18.6%), Green (4.8%), and Other (3.8%). On the right, a pie chart labeled ‘What we got (seats)’ shows: PC (64.5%), NDP (21.8%), Liberal (11.3%), Green (1.6%), and Other (0.8%). The infographic highlights the discrepancy between votes cast and seats won under the first-past-the-post system.
Consider it harm reduction.
@CowsLookLikeMaps voting is not harm reduction, just say you don’t care about drug users.