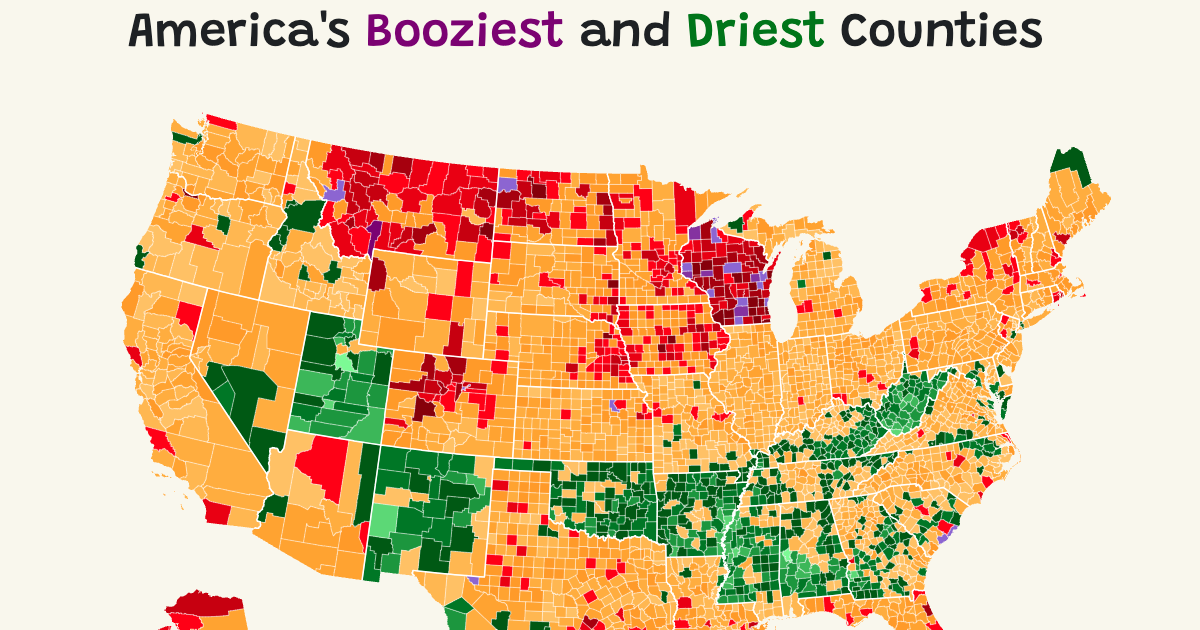
This doesn’t look right - why do drinking patterns follow some state borders like that? Culture doesn’t vary sharply across state lines, and state laws regarding liquor aren’t that different…
The map leverages data from the latest annual datasets of the CDC’s Behavioral Risk Factor Surveillance System and the County Health Rankings & Roadmaps (CHR&R) program.
Is this a combination of several separate sets of data (e.g. one for Texas and another for Oklahoma) which had different methodologies? Why else is Oklahoma (including its narrow panhandle) so different from both Texas and Kansas?
Using Wyoming as an example, all of the red spots are cities, everything else is miles upon miles of mostly empty BLM land. That one spot that’s super red? Laramie, the town with the only 4 year university in the state, with a direct path to Fort Collins just south of that, another massive college city. You can also see the Grand Valley lit up because of all of the Mormons stopping in Delta or Grand Junction to buy booze to bring home (dry counties abound in Utah and Idaho)

This doesn’t look right - why do drinking patterns follow some state borders like that? Culture doesn’t vary sharply across state lines, and state laws regarding liquor aren’t that different…
Is this a combination of several separate sets of data (e.g. one for Texas and another for Oklahoma) which had different methodologies? Why else is Oklahoma (including its narrow panhandle) so different from both Texas and Kansas?
deleted by creator
Using Wyoming as an example, all of the red spots are cities, everything else is miles upon miles of mostly empty BLM land. That one spot that’s super red? Laramie, the town with the only 4 year university in the state, with a direct path to Fort Collins just south of that, another massive college city. You can also see the Grand Valley lit up because of all of the Mormons stopping in Delta or Grand Junction to buy booze to bring home (dry counties abound in Utah and Idaho)
https://www.instagram.com/p/CClq5qAMqsN/?utm_source=ig_web_copy_link
deleted by creator
The difference is real, Wisconsin has the Tavern League. Powerful group and a big reason why theres no legal weed in Wisconsin.
Meanwhile it’s surrounded by states with legal weed.