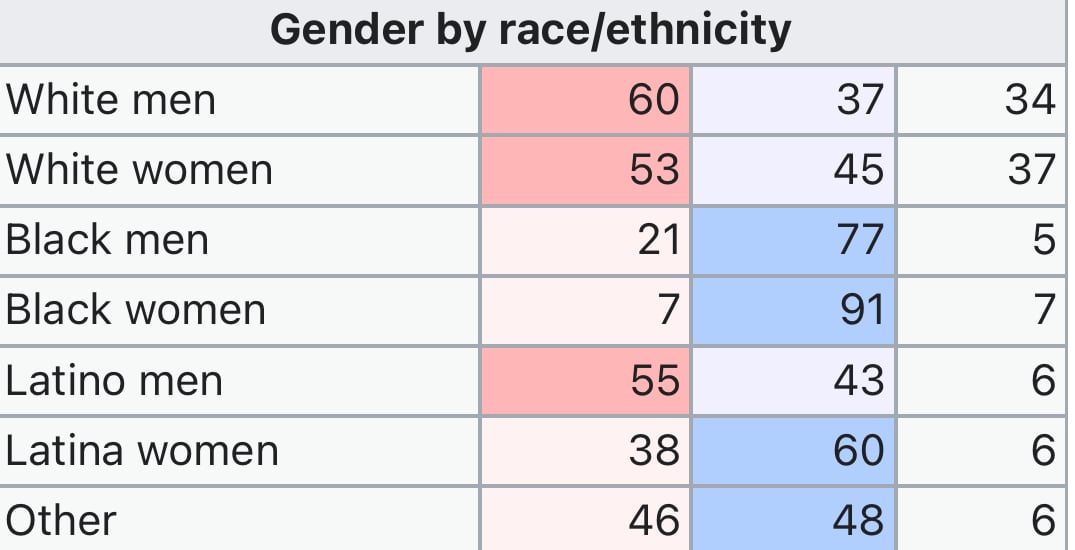
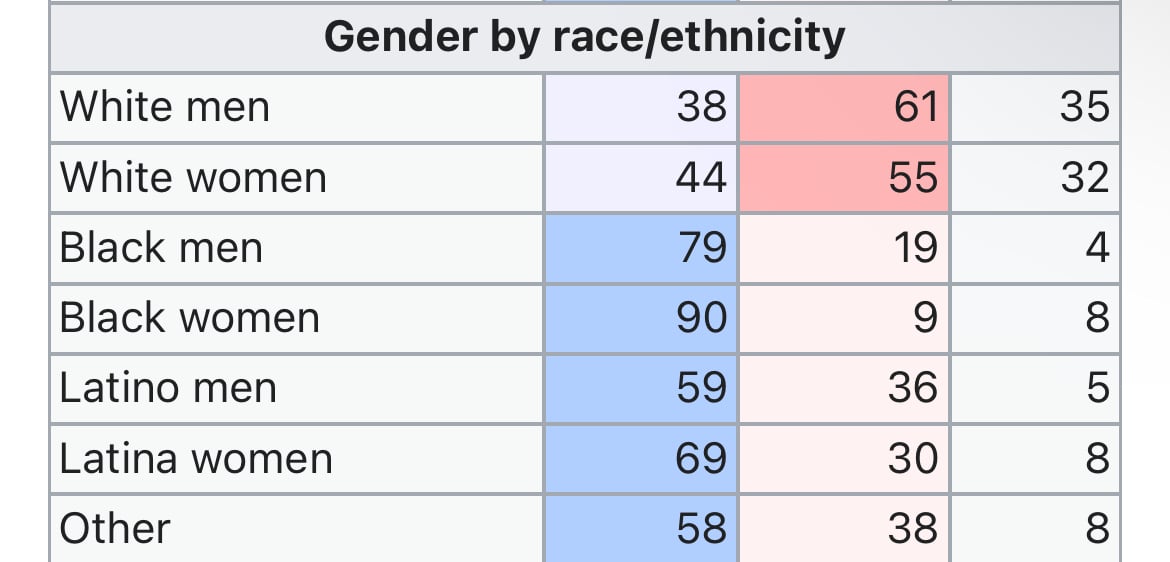
Now that we have final numbers. It appears that Harris had all the white & black support she needed for an EC victory. But Trump outright flipping Latino men and making huge gains with Latino women seems to have made all the difference.
What do you think?


First image is 2024, second is 2020.


It’s really unclear, to me, what these tables are even saying. What’s each column?
Collumn 1 is Percentage that voted for the Winner (Republican 2024/Democrat 2020), Column 2 the Loser, Column 3 is the percentage of the people polled.
So row Latino men: 55% voted for Trump, 43% Voted for Harris, and 6% of the exit poll said they were Latino men.
The first two columns is what percentage each party receive for that particular demographic. The third column is the percentage that demographic made up of the total votes.
So the each rows first two columns should add the 100%. The final column should add to 100%.