
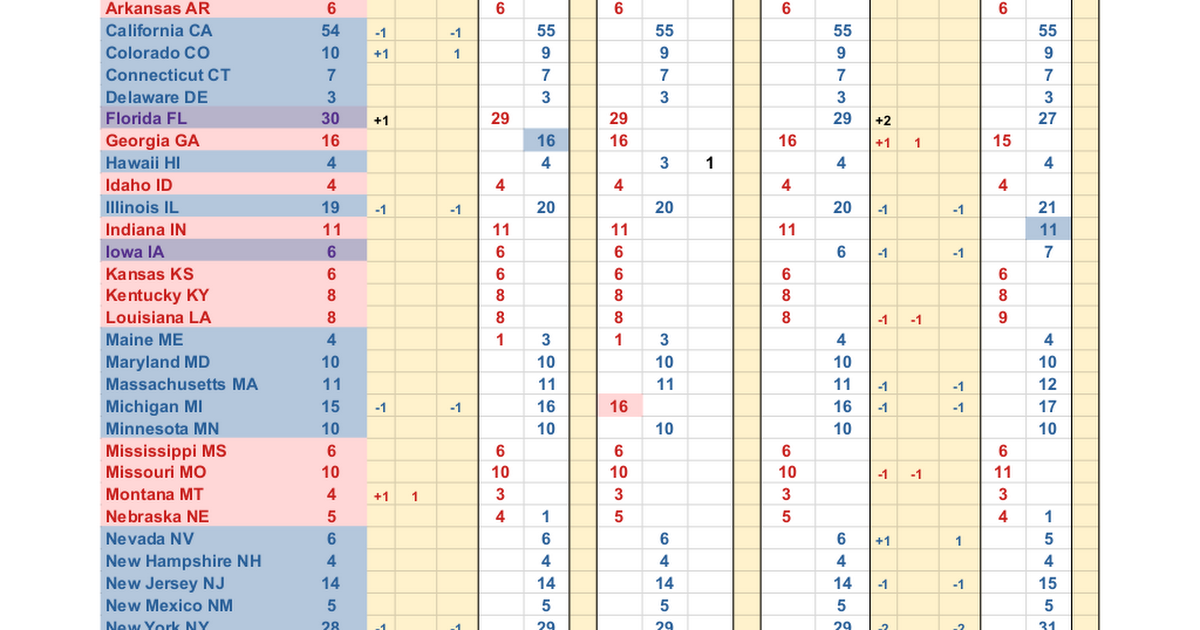
After noticing the electoral votes changed for this election from the last in 2020, I counted the change in differences of republican states and democratic states, ignoring the swing states. I noticed republican states gained more votes this time than last, and democratic states lost votes, overall giving republicans more electoral votes for this election. Then I kept on going all the way back to almost the civil war. To me, it seems the electoral college has been favoring red states from 1968 to present time. I want to post this somewhere to get feedback if there is a legit trend (red/right leaning) or I have missed something or anything else.
I tried to color the sheets so they are not too hard to read and understand. I also color coded conservative party as red, and liberal party as blue. There was a party shift between 1960 and 1980, probably having 1971 as the inflection point (WTF happened in 1971?). It was interesting to see some states stay mostly their colors from the remnants of the civil war to present day. You should be able to download the document, if you want.
Also, should I also send this to my representative or would that be pointless, or fruitless?
Assuming only red states have low population and grows faster is weird, but might be plausible. I could look into historical birth rates of each state, or population changes, comparing them to each other to see if the trends make sense. I assumed (or didn’t think of) there wouldn’t be bias growth rates based on state affiliation (red or blue). My first thought was gerrymandering and could it cause this bias. Either way, I didn’t think about population growth having an inherent bias in this.