
Data scraped from Aviation Safety Network
You must log in or register to comment.
Surpassing Trump’s 2nd last year in office.
Of the 85 this year, 79% (67) were from one crash.
Yet the Jan. 29 crash in Washington that killed 67 people is the only fatal commercial aviation crash in 2025 and in the past 15 years.
Y’all thinking this is meaningful have the memory of a goldfish.
Another 10 came from the commercial commuter in Alaska - https://www.alaskasnewssource.com/2025/02/07/missing-plane-found-3-people-reported-dead/
Meaning there were two commercial aircraft crashes in the first 2 months of the year.
fatal crashes. don’t forget the one that bounced and flipped upside down.
I think that technically counts against Canada, but not actually sure.
The graph clearly says fatalities, not crashes, but whatever makes you feel comfortable, sure.
The point is there is certainly some intent for visualizing and sharing the data, and a nuanced understanding of the circumstances make it obvious that, as yet, the number of fatalities while tragic, is not indicative of any trend yet. If you went by “number of fatal incidents” the graph would look less anomalous. We’ve had many years without any passenger liner incidents, and this year we have had one.
So it’s a graph that wants to be suggestive of something but ultimately shouldn’t be considered suggestive of any comparative significance. It’s data that is precisely what it purports to be, but there are intended inferences that have to be answered.
even so the number of fatal commercial flight crashes is like 4 in 2024. it’s 2 in two months this year.
deleted by creator
Pretty striking - I’d add a title to the top and the source in the lower right. Would make it much more shareable.
Edit: And a note about 2025 only being up to February 17th. Because the graph may outlive the
next Delta flightweek.Sure, how does this look

I want it in green.
Think that would be good to edit the post to show that image instead
done
Excellent 👍
Assuming this is counting people not crashes an average of 40 jumping to 80 doesn’t appear too shocking as I would think that meant one or so more crashes than normal. Unless it’s a bunch of really small planes.
The striking part is that it’s so much higher while we’re 7 weeks into the year. The other years include all 52 weeks. Also 40 is close to the maximum for previous years on the chart, not the average, which I’d estimate around 25.
The number of fatal incidents is probably more informative for most conclusions. We rarely have a passenger airliner incident and this year we had one. That really moves number of deaths statistics despite not having a particularly informative different cause than other aviation accidents.
Average is 26.92 excluding 2025
great point I didn’t consider that
The data oligarchs now have makes it easy to kill political opponents with plausible deniability.
Ooh, now do some linear extrapolation. We’re gonna break some records in 2025. Too bad they’re the ones you don’t want to break.
Sure but let’s include the graph back to ~2000 or so
So far ~30x higher this year than last year. If we extrapolate, I would expect something like 600 deaths assuming it stays the same
That means every American will be dying in plane crashes by 2029! Wow, data is amazing!
nuclear tipped cruise missiles count as planes right?
Unfortunately, this graph doesn’t consider that one incident can skew the data strongly because large incidents don’t happen yearly. (And the last incident of this magnitude was This means you can’t infer a trend from this graph alone.
If you include dates back to the 1990s, things look a lot worse then than now.
Was 2001 a bad year because of 9/11?
9/11 deaths are usually not counted, but even when counted the spike is not as noticeable as you might think.
 This graph shows data without 9/11, add 265 for the passengers and crew of the 4 planes. I think this graph is also the entire world and not just the USA.
That one bad incident (I assume you mean the helicoptor crash) had 67 fatalities. If you remove it, you still get 19 across 4 accidents, which is still way worse than previous years
But have you considered it’s still only February
NGL, 8 years seems a little sus. I’d have questioned it less if it were 10.
Was there something that happened in 2012 that would have made this less dramatic?
I propose the same graph but covering 25 years just to be sure to include a definite outlier.
This data only seems to cover part 121 and part 135 fatalities. In 2012, that was 9.
https://www.ntsb.gov/safety/data/Pages/2012-Avaiation-Accident-Summary.aspx
Assuming we can trust a .gov site’s data.
8? It’s 12 full years + 25
I just made 10 paginated requests to the api, and that covered till partially through 2012, so I dumped that and did '13 through now
Fuck. I’m old.
omg! someone needs to do something about access to this data! /s
So what changed in 2025? Scratching head. 🤷
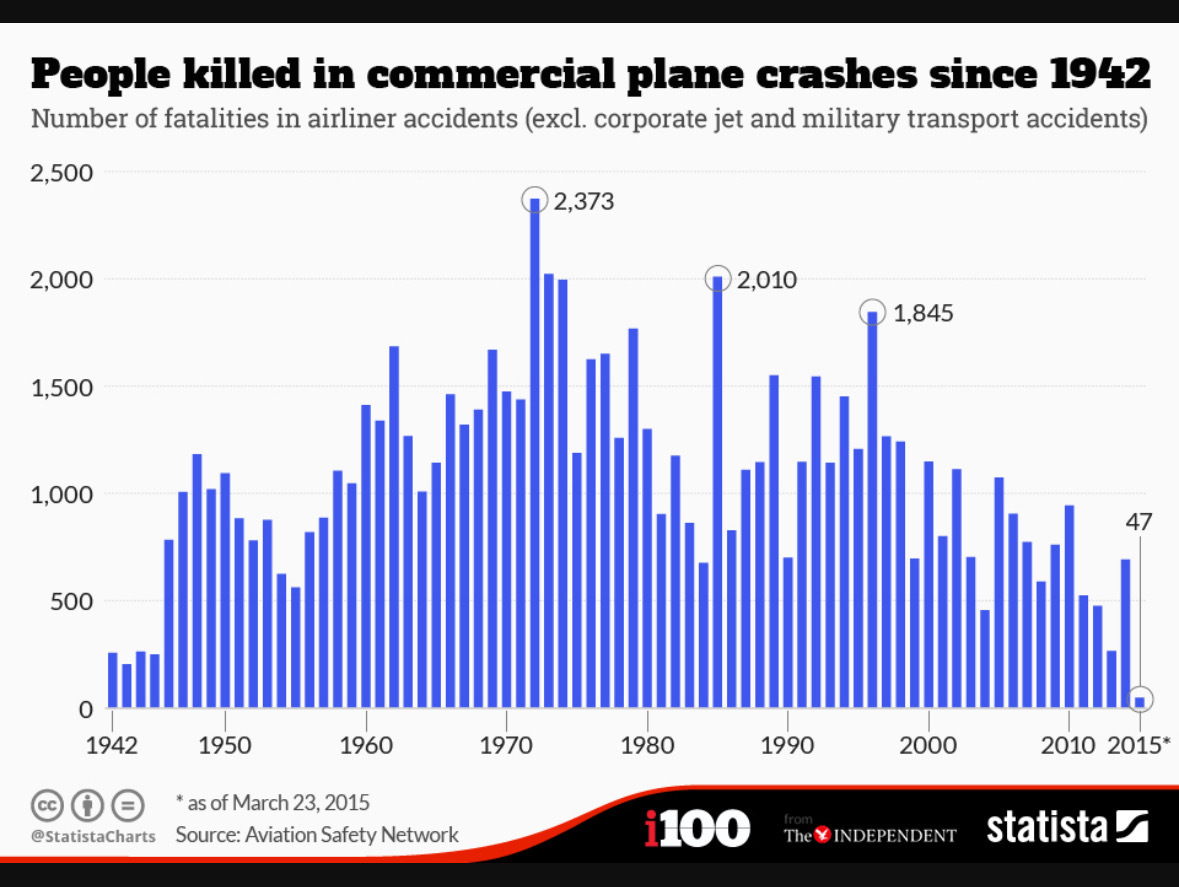
There seems to be a lot of talk around airplane crashes these days, so I decided to figure out how bad it really was
Data from https://asn.flightsafety.org/ and plotted using pyplot
2025 Data is only until February 17th
So, it’s pretty impressive what you put in the graph, but what the fuck you think it’s happening?
EDIT: Sorry, I didn’t want to come across as ungrateful, it’s just too damn weird.
I’m OOTL. I assume some sort of funding or regulation got dropped or is it just freaky coincidence?
Edit: Lol, I love the two downvotes. “Hey! Fuck you for not knowing something and being curious enough to ask, you fucking asshole!”
The crash in DC is the big one and accounts for about 2/3 of the 2025 numbers. Incidents like that don’t happen every year and will skew this somewhat.
That said, removing that outlier still leaves us with enough fatalities in 2 months to reach our yearly average. I think many of them are still being investigated, so it’s hard to say for sure what would cause this increase.
It’s hard to say, but
this was before the major accident: [1] https://apnews.com/article/coast-guard-homeland-security-priorities-committees-trump-tsa-d3e4398c8871ada8d0590859442e092c [2] https://www.latintimes.com/aoc-says-trump-gutted-aviation-safety-committee-last-week-blames-him-elon-dc-crash-574130
This started later, no crashes have happened since then https://apnews.com/article/doge-faa-air-traffic-firings-safety-67981aec33b6ee72cbad8dcee31f3437
So could be a little from column A and B. Unfortunate coincidence that may not be entirely coincidence but may also just he coincidence.
If it continues any more, coincidence is off the cards