
Anyone else getting some random errors and 500s on here recently?
Hey all,
I just posted an update here https://sh.itjust.works/post/49787
I probably should have listened to my gut and not have went to bed last night.
Should be fixed now, it was related to an nginx setting that needed to be tuned.
I’d hope sleep takes priority.
You got some monitoring in place? Can offer some assistance with monitoring ideas if you need, is part of what I do.
Also take care of yourself. We can go outside if we can’t log in. Or go back to work…
deleted by creator
I can give a brief(ish) overview sure.
Monitor everything :P
But really monitor meaningfully. CPU usage matters but a high CPU usage doesn’t indicate an issue. High load doesn’t mean an issue.
High CPU for a long period of time or outside normal time frames does mean something. High load outside normal usage times could indicate an issue. Or when the service isn’t running. Understand your key metrics and what they mean to failures, end user experience, and business expectation.Start all projects with monitoring in mind, the earlier to you begin monitoring the easier it is to implement. Re configuring code and infrastructure after the fact is a lot of technical debt. If you are willing and can guarantee that debt will be handled at a later time then good luck. But we know how projects go.
Assign flags to calls. If your application runs results in a response that’s started from and ends up at an end user, Send an identifying flag. Let that flag travel the entire call and you are able to break down traces and find failures… Failures don’t have to be in error outs, time outs. A call that takes 10x longer than the rest of the calls can cascade and shows the inefficiency and realiability.
Spend time on log and error handling. These are your gatekeepers to troubleshooting. The more time spent upfront making them valuable, the less time you have to look at them when shit hits the fan.
Alerts and Monitors MUST mean something. Alert fatigue is real, you experience it everyday I’m sure. That email that comes in that has some kind of daily/weekly status information that gets right clicked and marked as read. That’s alert fatigue. Alerts should be made in a way that scales.
- Take a Look as a time allows - logs with potential issues
- Investigate as something could be wrong - warnings
- Shits down fix it - Alert
APM matters Collect that data, you want to see everything from processor to response times, latency, and performance. These metrics will help you identify not only alerting opportunities but also efficiency opportunities. We know users can be fickle. How long are people willing to sit and wait for a webpage to load…. Unlike the 1990’s 10-30 seconds is not groovy. Use the metrics and try to compare and marry them with business key performance indicators(KPI). What is the business side looking for to show things are successful. How can you use application metrics and server metrics to match their KPIs.
Custom scripts are great. They are part of the cycle that companies go through.
Custom scripts to monitor —> Too much not enough staff —> SAAS Solutions (Datadog, Solar Winds, Prometheus, Grafana, New Relic) —>. Company huge SAAS costs high and doesn’t accurately monitor our own custom applications —> and we’re back to custom scripts. Netflix, Google, Twitter all have custom monitoring tools.Many of the SAAS solutions are low cost and have options and even free tiers. The open source solutions also have excellent and industry level tools. All solutions require the team to actively work on them in a collaborative way. Buy in is required for successful monitoring, alerting, and incident response.
Log everything, parse it all, win.
My comment as someone who used to do this professionally:
4 golden signals:
- Latency (how long the transaction / query / function takes)
- Traffic (queries per second)
- Errors (errors per second)
- Saturation / Fullness (how close to maximum traffic are you. This can be I/O, how close are you to maximum bandwidth, memory: how close are you to running out of RAM, threads: how many serving threads are you using out of the total thread pool, CPU: how much free CPU capacity do you have)
Don’t veer too far from measuring those key things. You might be able to get many other rates and values, but often they’re derived from the key signals, and you’d be better off monitoring one of the golden signals instead.
3 types of alerts:
- Pages, as in “Paging Doctor Frankenstein”. High priority that should interrupt someone and get them to check it out immediately.
- Tickets / Bugs. These should be filed in some kind of bug reporting / ticketing system automatically. That system should be one where someone can look up the day’s or the week’s bugs and see what needs investigation, track it, and then ultimately resolve it. This level of alert is for things that are serious enough that someone should be periodically checking the bug / ticket system to see if anything needs investigation, but not important enough that someone should drop what they’re doing and look right away.
- Logs. Write info to storage somewhere and keep it around in case it’s useful for someone when they’re debugging. But, don’t page anyone or create a ticket, just keep the info in case someone looks later. Graphs are basically a form of logs, just visual.
Tempting as it may be, never email. Emails just get ignored. If it’s high priority you should page. If it’s not that high priority, file a bug / ticket.
For latency, use distributions: 50th percentile latency, 90th percentile latency, 99th percentile latency, etc. Meaning for 50th percentile, half the users have this much latency or better. For 99th percentile 99% of users have this much latency or better, 1% of users have this much latency or worse. The reason for this is that an average latency is not very useful. What matters are the outliers. If 99% of operations complete in 500 ms but 1% take 50s, the average latency will still be approx 500 ms, but that one operation that takes nearly a minute can be a sign of something, either breakage or abuse.
Black and white box monitoring are both important.
White box monitoring is monitoring as someone who knows the internals of the system. Say monitoring the latency of the GetFriendsGraph() call. As someone who knows the code you know that that’s key to performance, it has a DB as a backend, but there’s a memory cache, and so-on.
Black box monitoring is monitoring viewing the system as a black box whose internals you pretend you don’t understand… So, instead of monitoring GetFriendsGraph() you monitor how long it takes to respond to loading http://friends.example.org/list/get_buddies.jsp or whatever. That will include time doing the DNS lookup, time going through the load balancer, querying the frontend, querying the backend(s) backends, and so on. When this kind of monitor experiences errors you don’t know what the cause is. It could be broken DNS, it could be broken load balancers, it could be a DB crash. What it does tell you is that this is a user-visible error. With white-box monitoring you may know that the latency on a certain call is through the roof, but the black box monitor can say that it isn’t an issue that is actually affecting most users.
In terms of graphing (say GraphViz or whatever), start by graphing the 4 golden signals for whatever seems to be important. Then, treat the graphs like logs. Don’t stare at them all the time. Refer back to them when something higher priority (bugs / tickets or alerts) indicates that something needs an investigation. If additional graphs would have helped in the investigation, add more graphs. But, don’t do it just to have things to look at. Too many graphs just becomes visual noise.
This is pretty accurate to what I do professionally.
The point made here about the Average user experience is super super important. It’s good to know what that is for several reasons. Mainly performance tuning. But when it comes to trying to prevent disasters the middle isn’t useful.
Another thing to add. This came to me recently. There are two kinds of graphs and dashboards, those for technical folks and those for managers and non-technical folks. You want to develop both or one with variables to then simplify the graphs/dashboard. Annotations and good titles IMHO are good. Some folks prefer to have technical graph titles. I get the draw but I have to deal with multiple leads, C levels, project managers, and managers that don’t care about the technical stat just where it is compared to where it should be
Thanks for the reply. Do you know of any Fediverse community for people into things like monitoring, paging, alerts and occasional sleepless nights?
NP.
I haven’t looked really. There is a DevOps community I think. Haven’t seen any SRE (site reliability engineer) or monitoring communities, One will probably pop up sooner than later.
This might be a bit obtuse as I come from a DevOps background not an IT / Infrastructure background but I absolutely love Azure Application Insights. I’m not super familiar with how much it costs tho as I’ve never used it off a company card haha. It might not make sense for server monitoring as it’s built for watching applications.
bed is good! and a little downtime is good for the soul. thanks for all that you do <3
I want paid downtime for my soul 🫥
How about they refund you a portion of the money you paid for the service? :D
Sadly my soul is self made and if I try refunding myself I’ll end up like this:

Achievement Unlocked: The Tautologist
You gotta take care of yourself or you can’t take care of anything else.
Just happy you have a server running. No rush, get the sleep you need, and thanks for powering things (:
Yeah, this is specifically on sh.itjust.works for those viewing this thread elsewhere, but I’m sure other instances are struggling too. I’m not even seeing 500s, just a generic Firefox “Cannot complete request” on mobile and connection resets on Jerboa.
Edit: ah, yep, here come the 500s mixed in there as well.
We are absolutely testing server capacity right now. And the reddit blackout is just starting. Gotta be prepared.
Edit: Apparently we are not testing server capacity just yet, there was a configuration that needed to be updated on the back end, as per the Dude.
The blackout is currently happening at least in 5000 of the 7000 subs, I assume that’s why the errors are happening now.
Wow that’s insane! 86% of subs are private rn according to their stats
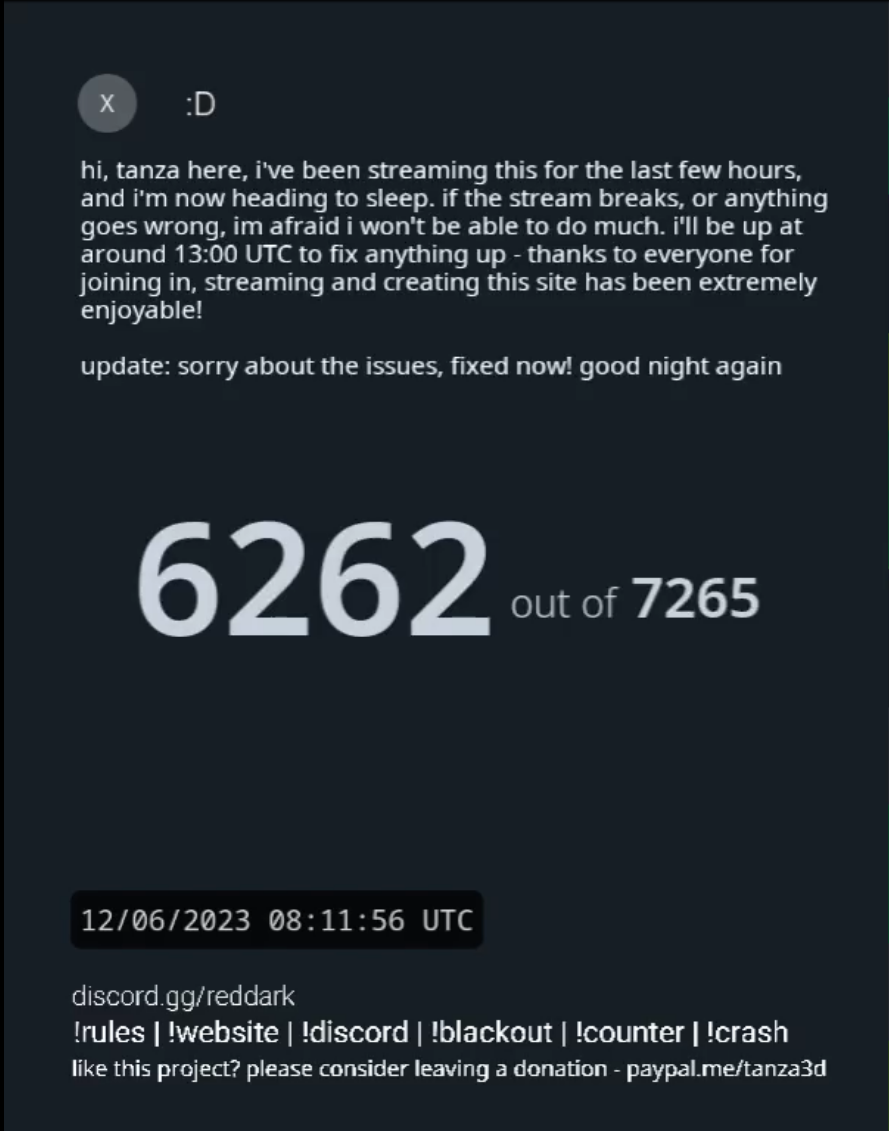
That’s 86% of the subs that said they would go dark, AFAIK. Not total reddit subs, I think there are something like 20k subs in reddit.
Ohh that makes sense. In hindsight it stands to reason that they have more than 7200 subreddits. Still though, even if 7200 go dark that’s a sizable chunk of a redditor’s daily consumption. I can only hope that the majority of those will stay private for more than 48h, probably wont do any good but it would at least send a strong message.
hope they go dark indefinitely.
There are over a million subs in reddit and like 140,000 of them are active.
Yeah I didn’t even realize it had already begun. I’m praying that this community stays alive, otherwise i gotta find another instance to make an account. Honestly I would love to get a donation link for the Dude but he’s too nice to ask for money. Just let us pay you and keep the server from going down bro.
Is that hyperbole or are there actual blackout stats somewhere?
Removed by mod
Holy fuck. Combined subscriber base of 2.5 BILLION. All going dark. We’re in danger 😳
FWIW those have a lot of overlap, it’s not unique subscribers. Plus there’s a couple of default subs included.
Yeah I know half of the world isn’t on reddit. I’m still impressed by the number of subreddits that went dark though.
A lot are restricted as well. Technically still ‘public’ but not allowing new posts/ comments.
Removed by mod
I think it’d be smart to make a discord or some kind of alternate channel in case this instance were to go down. We’ve gone from 0 to 2,000 users in a week, it’s important to have a channel to keep people updated if the server goes down. That way the Dude could at least let people know he’s working on it or whatever is going on.
A mailing list would suffice I think… but, than again, people don’t check mail that often.
Yep experiencing the same
I know this is an older post but I’ll comment anyway.
I haven’t been getting any errors, but sometimes when I browse, I’d be scrolling through the comments of a post, and suddenly the post would change.
I didn’t dig into it much, but if it starts happening more often, I’ll record my network traffic (for the browser) and attach the .har file.
Its a known bug just have to wait for the fix.
I am seeing the same.
Do these Lemmy instances have any kind of page where you can see the user and community count on the instance level?
Yea it’s at the bottom of the sidebar
I see some numbers on the side-bar on the right but those look more like community numbers than instance numbers
If you go to the front page outside of any community you can see a general sidebar for the entire instance.
Ah, thanks, found it now.
a few here & there
Yeah, since yesterday. 50/50 this post even makes it…
It made it!! 😎
Yeah, experiencing the same as well.
This is gonna get quickly out of hand… there should have been an announcement that you should NOT join the most popular instances and just scroll down the list to join an instance that is preferably at the very bottom of the list.
When I joined this one was one of the smaller ones lol. This instance has been alive for like 6 days.
Yeah, was, past tense 😂.
Loved the domain name, that’s why I joined 😂.
same, I’m always in places like this, my e-mails are all from cock.li. I just love giving someone something like “yeah hi, e-mail me the job offer to [email protected]”. And together with being a bit annoyed at the inefficiency of other lemmy instances and how much they focused on which political party and ideology they should follow, this one was a breath of fresh air :)
PS. I still find it to be the best working instance out of all that I have tried. The big ones are slow, the small ones have wrong setups and are buggy, this one is just perfect 💯
God’s stamp of approval
Agreed. Shit just works 🤔… yep, that’s the one I want 😂.
Is anyone else having trouble posting? I’ve had a lot of times when posts/comments fail to go through (“post” button stays as a spinning circle). Sometimes I can get it after a couple times, but I’ve been stubbornly trying to reply to one comment in c/games all day with no success, despite posting a thread there and making some other posts.
Yup just ran into this problem. First reply gave me the endless spin. Second reply on the same sub went through no problem.
Both on here and lemmy.world, yes. Comments and edits successfully post, but the spinner sometimes goes forever.